Archetype: Log a double-precision scalar that will be visualized as a time-series plot. More...
#include <rerun/archetypes/time_series_scalar.hpp>
Public Types | |
| using | IndicatorComponent = components::IndicatorComponent< IndicatorComponentName > |
| Indicator component, used to identify the archetype when converting to a list of components. | |
Public Member Functions | |
| TimeSeriesScalar (TimeSeriesScalar &&other)=default | |
| TimeSeriesScalar (rerun::components::Scalar _scalar) | |
| TimeSeriesScalar | with_radius (rerun::components::Radius _radius) && |
| An optional radius for the point. | |
| TimeSeriesScalar | with_color (rerun::components::Color _color) && |
| Optional color for the scalar entry. | |
| TimeSeriesScalar | with_label (rerun::components::Text _label) && |
| An optional label for the point. | |
| TimeSeriesScalar | with_scattered (rerun::components::ScalarScattering _scattered) && |
| Specifies whether a point in a scatter plot should form a continuous line. | |
| size_t | num_instances () const |
| Returns the number of primary instances of this archetype. | |
Public Attributes | |
| rerun::components::Scalar | scalar |
| The scalar value to log. | |
| std::optional< rerun::components::Radius > | radius |
| An optional radius for the point. | |
| std::optional< rerun::components::Color > | color |
| Optional color for the scalar entry. | |
| std::optional< rerun::components::Text > | label |
| An optional label for the point. | |
| std::optional< rerun::components::ScalarScattering > | scattered |
| Specifies whether a point in a scatter plot should form a continuous line. | |
Static Public Attributes | |
| static constexpr const char | IndicatorComponentName [] |
Detailed Description
Archetype: Log a double-precision scalar that will be visualized as a time-series plot.
The current simulation time will be used for the time/X-axis, hence scalars cannot be timeless!
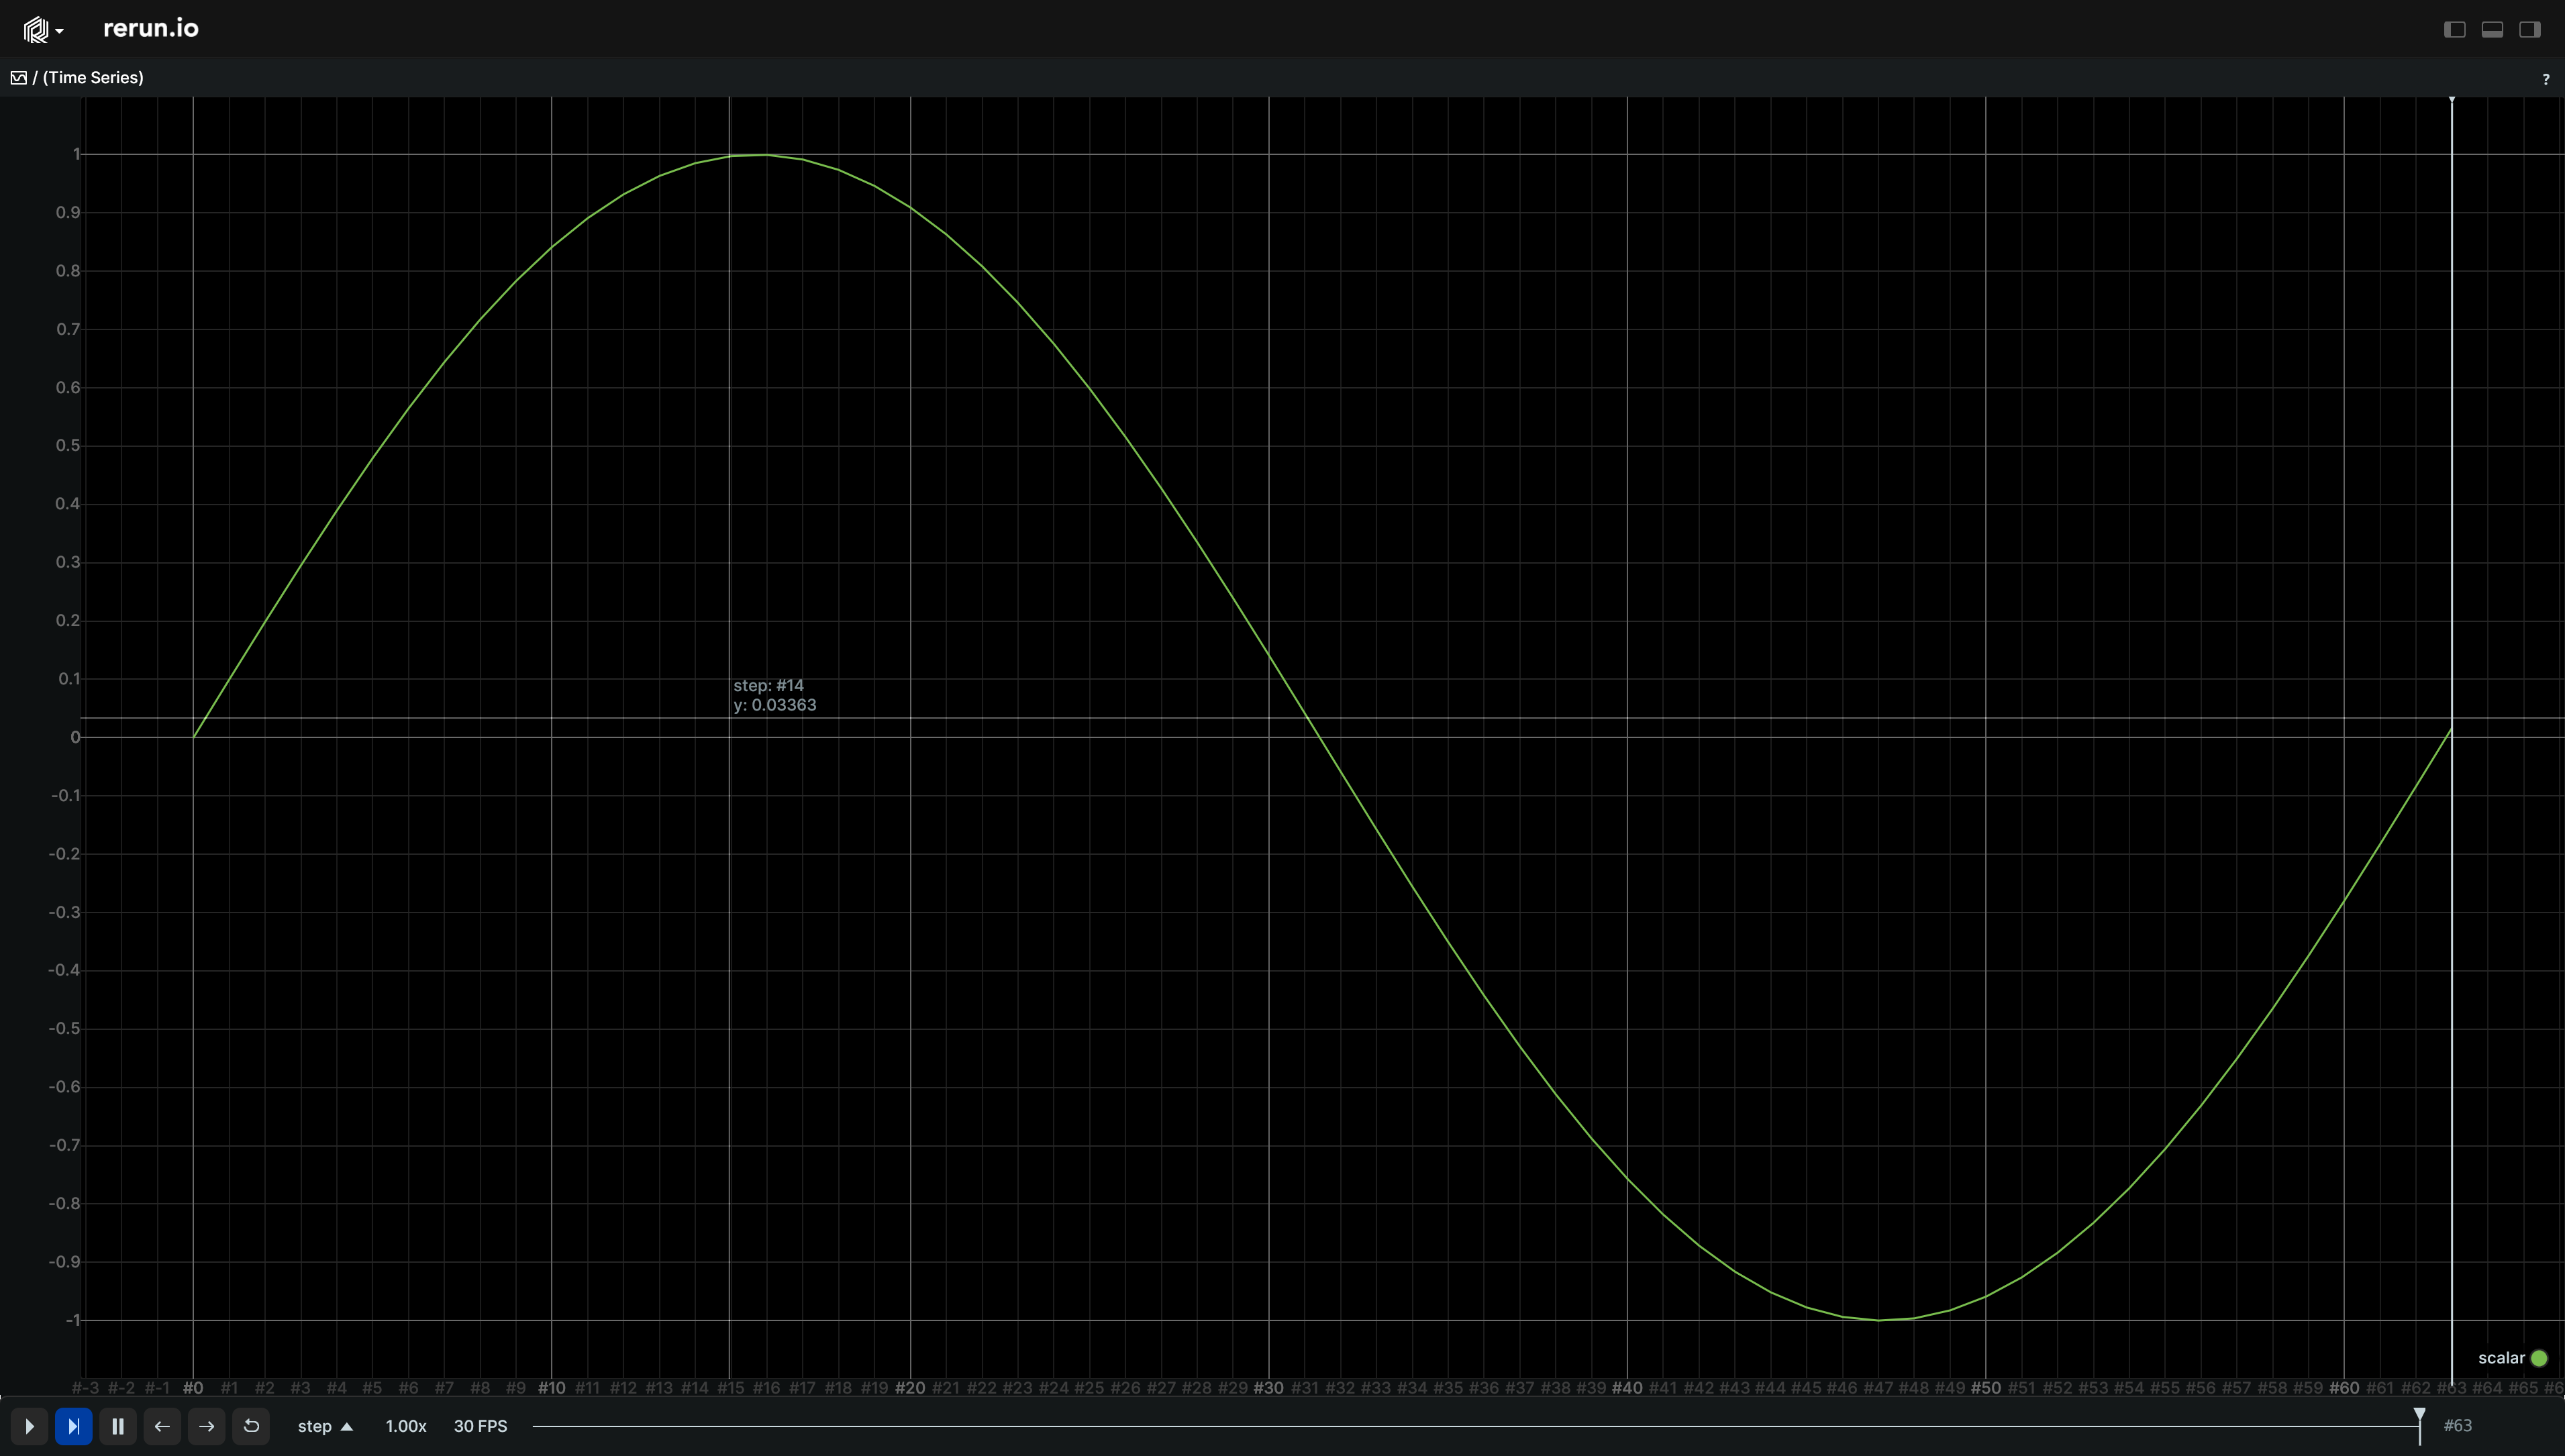
Example
Simple line plot
Member Function Documentation
◆ with_radius()
|
inline |
An optional radius for the point.
Points within a single line do not have to share the same radius, the line will have differently sized segments as appropriate.
If all points within a single entity path (i.e. a line) share the same radius, then this radius will be used as the line width too. Otherwise, the line will use the default width of 1.0.
◆ with_color()
|
inline |
Optional color for the scalar entry.
If left unspecified, a pseudo-random color will be used instead. That same color will apply to all points residing in the same entity path that don't have a color specified.
Points within a single line do not have to share the same color, the line will have differently colored segments as appropriate. If all points within a single entity path (i.e. a line) share the same color, then this color will be used as the line color in the plot legend. Otherwise, the line will appear gray in the legend.
◆ with_label()
|
inline |
An optional label for the point.
TODO(#1289): This won't show up on points at the moment, as our plots don't yet support displaying labels for individual points. If all points within a single entity path (i.e. a line) share the same label, then this label will be used as the label for the line itself. Otherwise, the line will be named after the entity path. The plot itself is named after the space it's in.
◆ with_scattered()
|
inline |
Specifies whether a point in a scatter plot should form a continuous line.
If set to true, this scalar will be drawn as a point, akin to a scatterplot. Otherwise, it will form a continuous line with its neighbors. Points within a single line do not have to all share the same scatteredness: the line will switch between a scattered and a continuous representation as required.
Member Data Documentation
◆ radius
| std::optional<rerun::components::Radius> rerun::archetypes::TimeSeriesScalar::radius |
An optional radius for the point.
Points within a single line do not have to share the same radius, the line will have differently sized segments as appropriate.
If all points within a single entity path (i.e. a line) share the same radius, then this radius will be used as the line width too. Otherwise, the line will use the default width of 1.0.
◆ color
| std::optional<rerun::components::Color> rerun::archetypes::TimeSeriesScalar::color |
Optional color for the scalar entry.
If left unspecified, a pseudo-random color will be used instead. That same color will apply to all points residing in the same entity path that don't have a color specified.
Points within a single line do not have to share the same color, the line will have differently colored segments as appropriate. If all points within a single entity path (i.e. a line) share the same color, then this color will be used as the line color in the plot legend. Otherwise, the line will appear gray in the legend.
◆ label
| std::optional<rerun::components::Text> rerun::archetypes::TimeSeriesScalar::label |
An optional label for the point.
TODO(#1289): This won't show up on points at the moment, as our plots don't yet support displaying labels for individual points. If all points within a single entity path (i.e. a line) share the same label, then this label will be used as the label for the line itself. Otherwise, the line will be named after the entity path. The plot itself is named after the space it's in.
◆ scattered
| std::optional<rerun::components::ScalarScattering> rerun::archetypes::TimeSeriesScalar::scattered |
Specifies whether a point in a scatter plot should form a continuous line.
If set to true, this scalar will be drawn as a point, akin to a scatterplot. Otherwise, it will form a continuous line with its neighbors. Points within a single line do not have to all share the same scatteredness: the line will switch between a scattered and a continuous representation as required.
◆ IndicatorComponentName
|
staticconstexpr |
The documentation for this struct was generated from the following file:
- rerun/archetypes/time_series_scalar.hpp